Ganbatte!
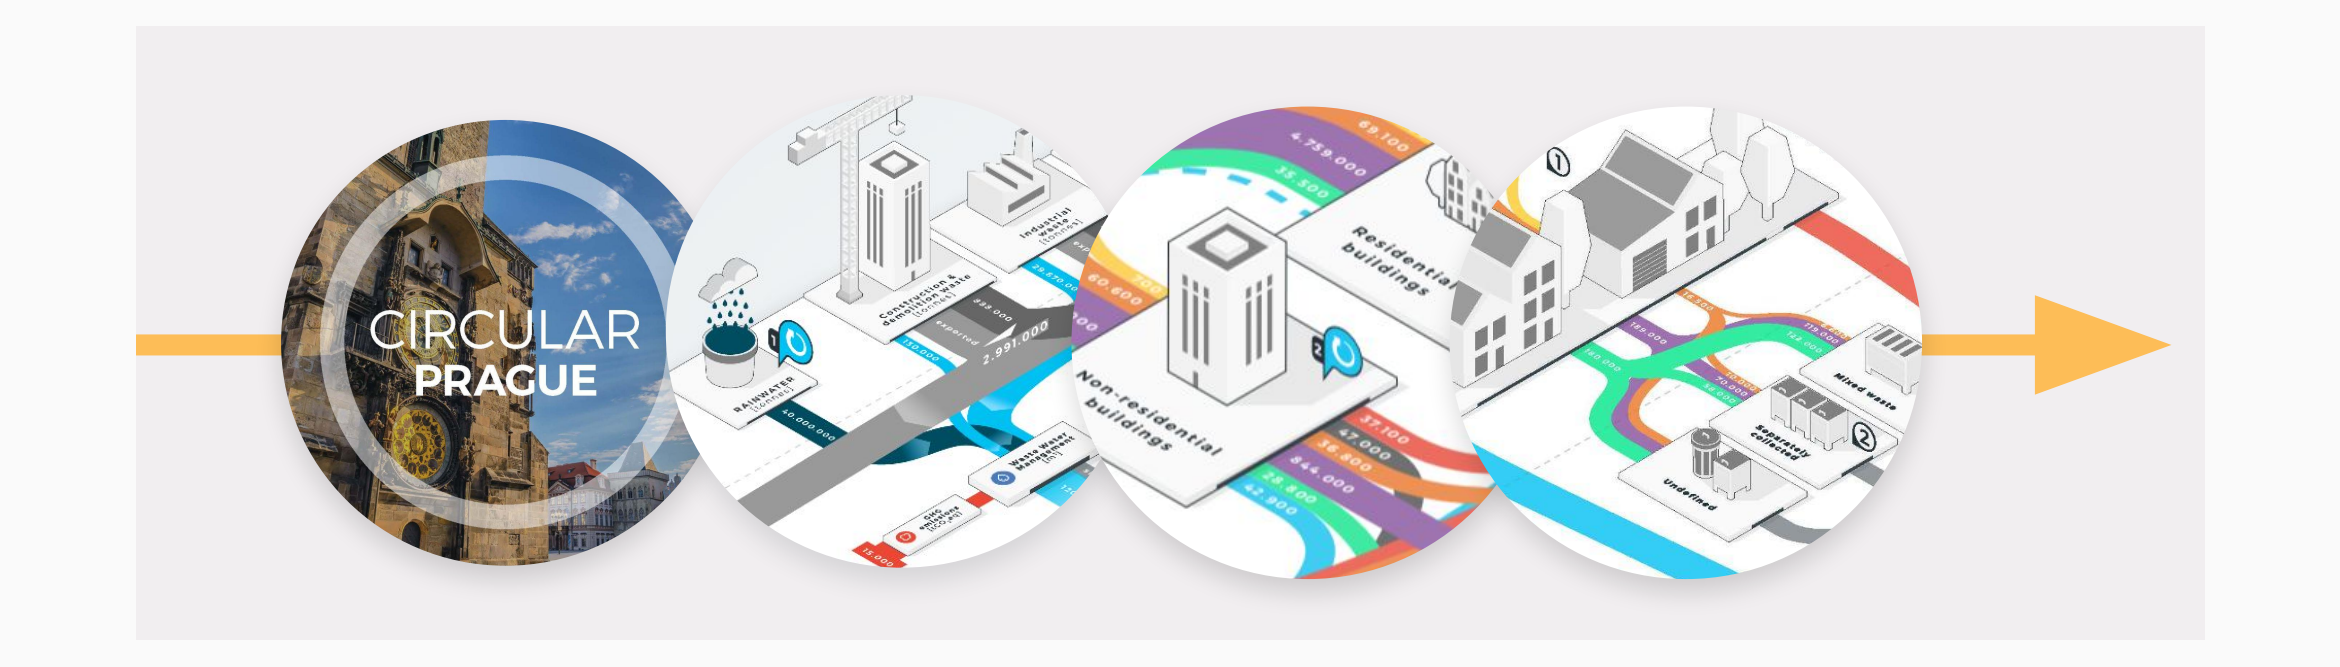
Ganbatte is a platform that helps local circular experts with data, insights and tools to make local organisations more circular. My role in this part was to set up the process, inform the roadmap, set the vision and strategy with the product manager, and execute the user research and the product design. I worked on the different parts of the products over 2 years with a small team of a product manager, 3 developers and 1 other junior product designer I hired. One of the products we designed and launched is Ganbatte World. It helps starting cities in the circular economy with practical solutions and data on their material flows.
Goal of Ganbatte
At CE (Circle Economy) the main services they offer are called “scans’. These scans often include data collection, data analysis, data visualisations, visioning, and advise where to focus on and what strategies to use. Those elements all come together in a report as the deliverable of the project. These scans are done for businesses, cities or governments and the amount of time they take differs a lot depending on which of those type of clients it is for as well as on the size of the clients organisation. This is a tried and trusted way of making impact, the only issue is that it takes quite some people and time to realise it. Meaning you could only make so much impact as you have people. Ganbatte wants to mimic most of what the scan’s do by offering a digital product at a lower cost, with the ability to scale impact to the world.
Big user research challenges
Target groups
Hero: This is the primary target group, it means organisations that help their local businesses, cities or governments to become more circular. They are knowledgeable about circularity and give advise to rebels on how to become more circular.
Rebel: People who want to make their organisation more circular. There are 3 types of rebel organisations: businesses, cities or governments. Rebels need hero’s to become more circular as they often don’t have time, resources or expertise.
Follow the money
Circle Economy is a non-profit that partially runs on funding for it’s income. Some fundings have strings attached to them and want to focus on a specific thing. This could be that they want to focus on making circular impact in cities in mainly the global south, which is our case. This results in sometimes needing to bend along with what the funding wants to achieve thus to focus on a specific target group.
Make impact where possible
Because of the way funding works and the impact CE likes to make worldwide, the strategy is to keep options open and not zoom in to 1 particular geography. Resulting in a lack of geographical focus for Ganbatte as well. There are big differences in what topic within circularity is important to focus on per country (and even per city). Another challenge is the data availability per country, EU countries have data available on materials but countries in southeast Asia don’t have that.
CE and funders focus on businesses cities and nations, which in turn makes Ganbatte also be split on those three target groups.
From research it was clear that businesses, cities or governments each have relatively the same needs, but when it comes down to details they are different. The frameworks, taxonomies, data visualisations, types of data points and what data is available is different per rebel type (e.g. sectors in a city are different from departments in a company).
"If you design for everyone, you delight no one”
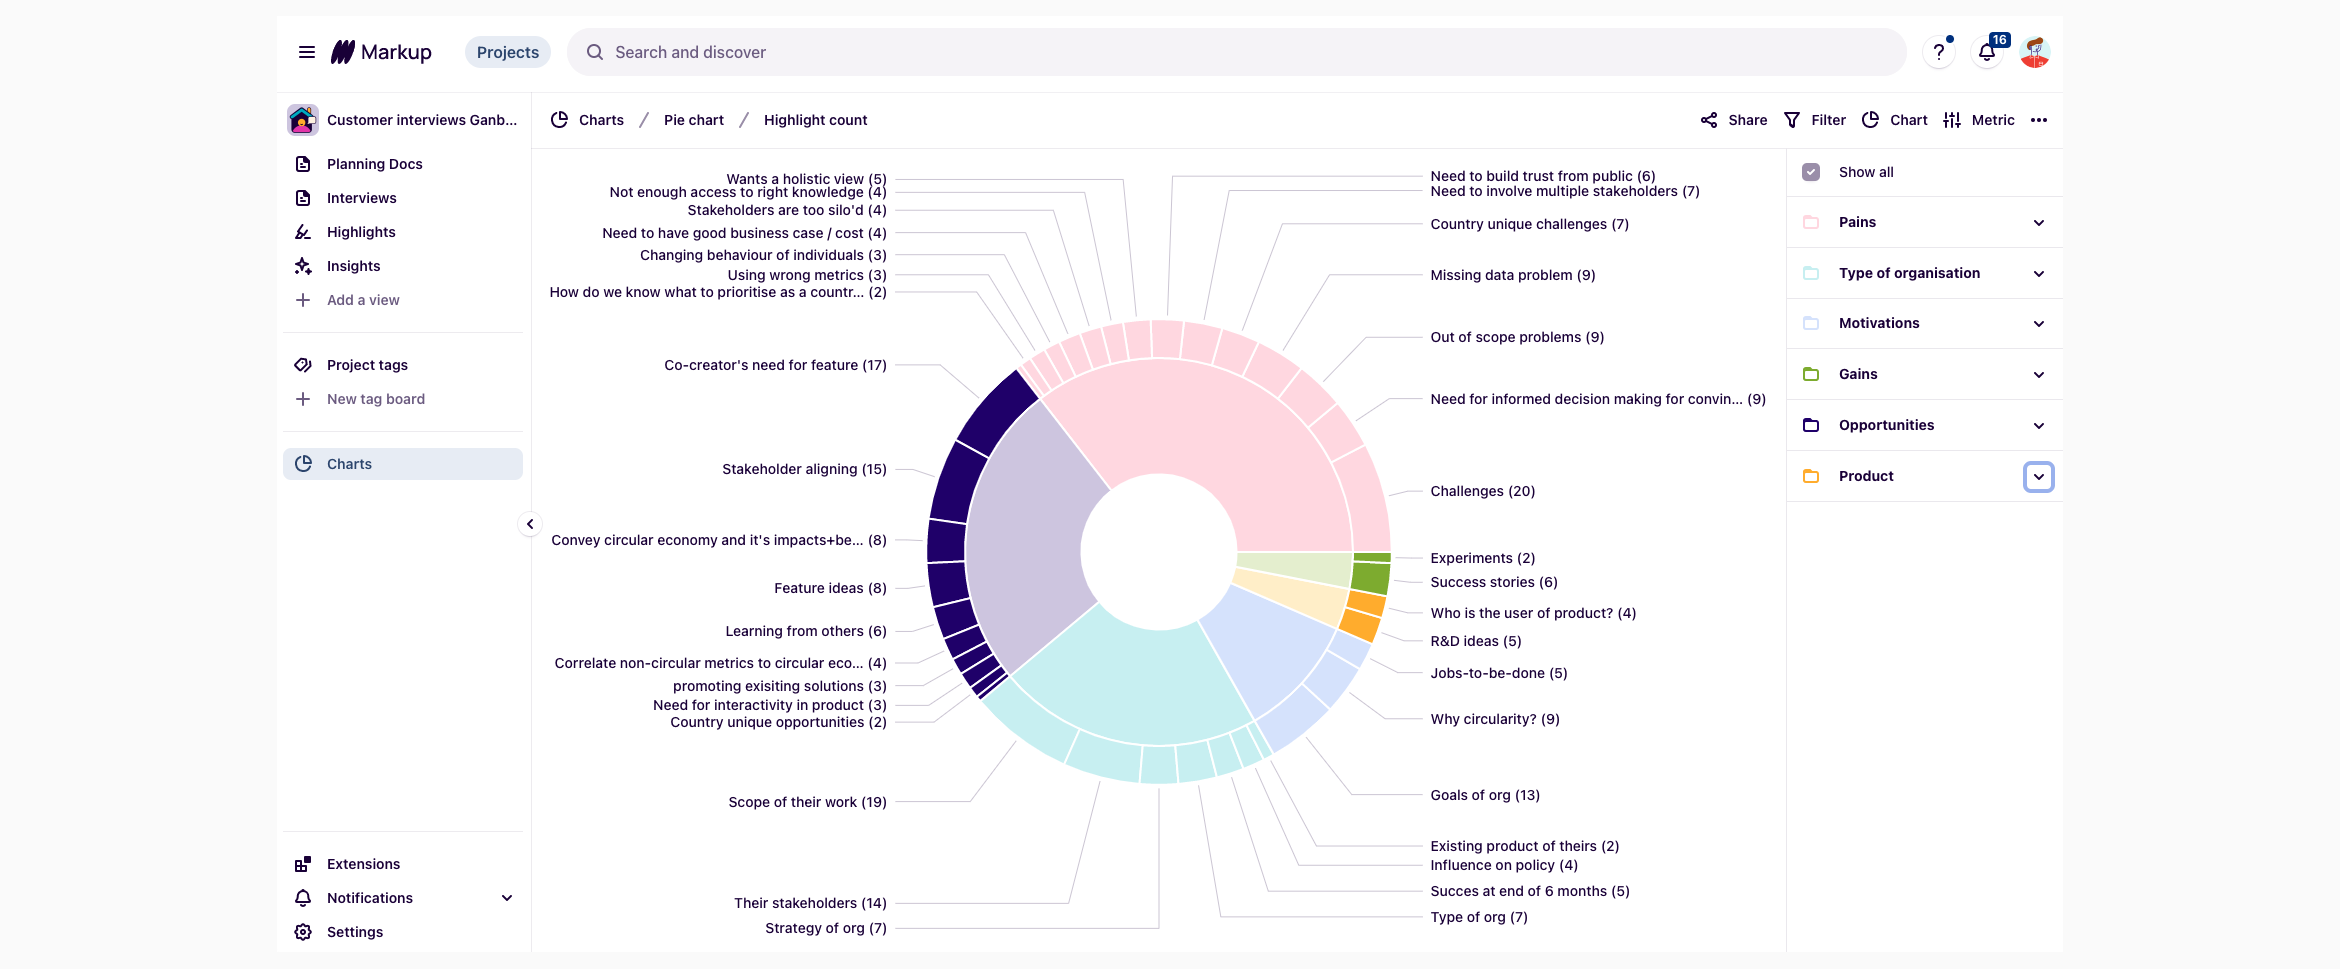
So by lack of focus and by nature of how funding works, we distributed our efforts across the different types of rebels. This is the reason why you will see a few different products that are tailored to different type of rebels. Most importantly, this resulted in thinly stretched user research because it’s across the three types of rebels and no geographical focus. This in turn also made it hard to design and test. There were too little details on the target group and test results became a bit unreliable.
Solution? focus on the overlap and design modular
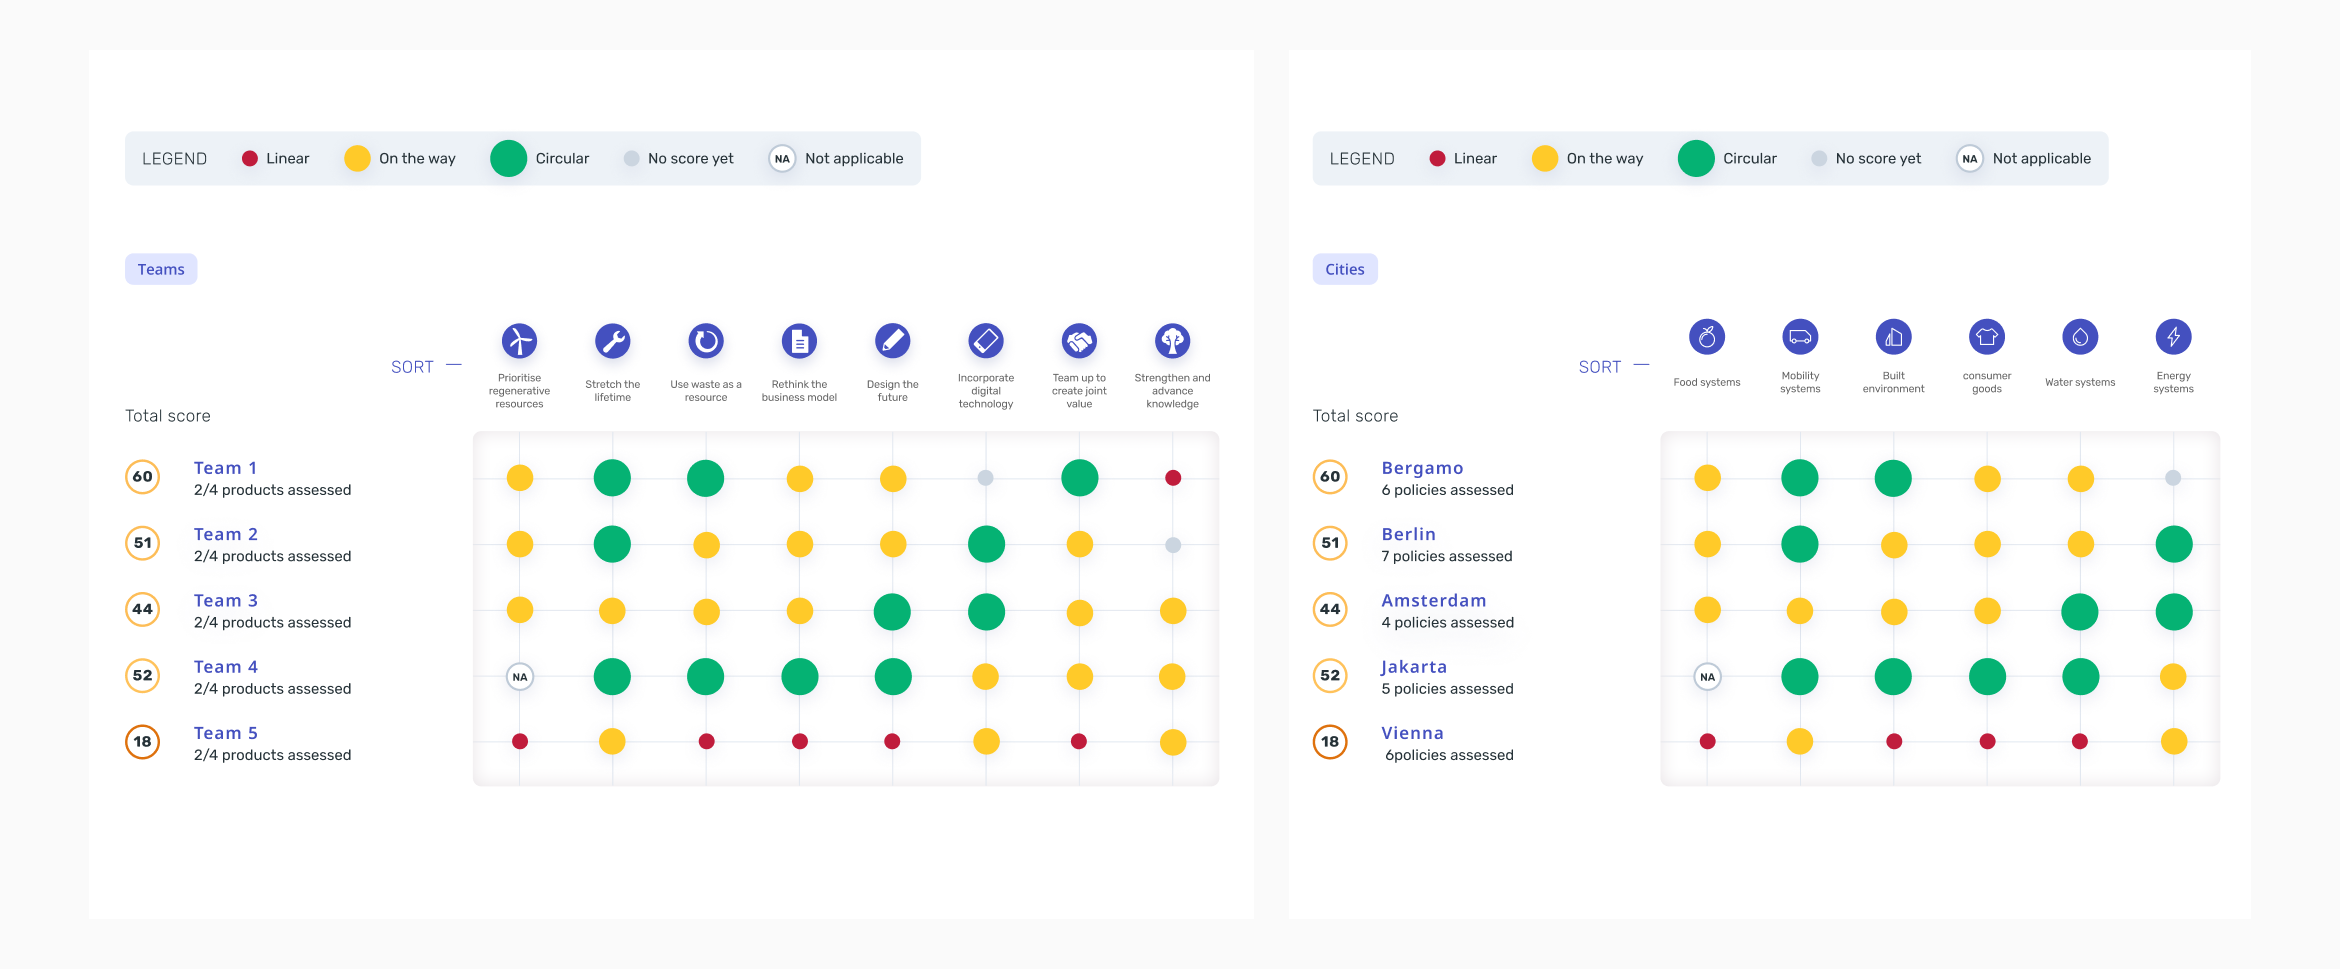
Across my time at Circle Economy I interviewed, tested and surveyed a lot of potential users and stakeholders. Luckily for us a lot of those needs were similar across hero’s and rebels. In order to not triple the work we focused on the overlapping needs only. By doing so we worked to maintain value for the user whilst also designing components modular so that they work for each rebel type. In the example above the title we designed 1 data visualisation in such a way that it works for city officials as well as for CSR managers at businesses. It basically shows an overview of survey scores of rebels per category that they scored in. We can switch in/out the framework/taxonomies/data of the other type of rebel and make it work for the same need.
Provide insights
Often hard data is missing to know what should be focused on. So we developed surveys to let them score on specific categories. For example 1 survey asks questions with case study examples on how circular policies in city surrounding food systems are. This way hero’s can send surveys to rebels and still get valuable insights that they can advise them on.
The data visualisation above the title helps the hero to get an overview of who of their rebels works best/worst in which category. These insights are important to hero’s and how they go about using them is quite different per hero. Some sit two rebels together to try and exchange best practices, others focus on the lowest scoring rebels and advise them directly.
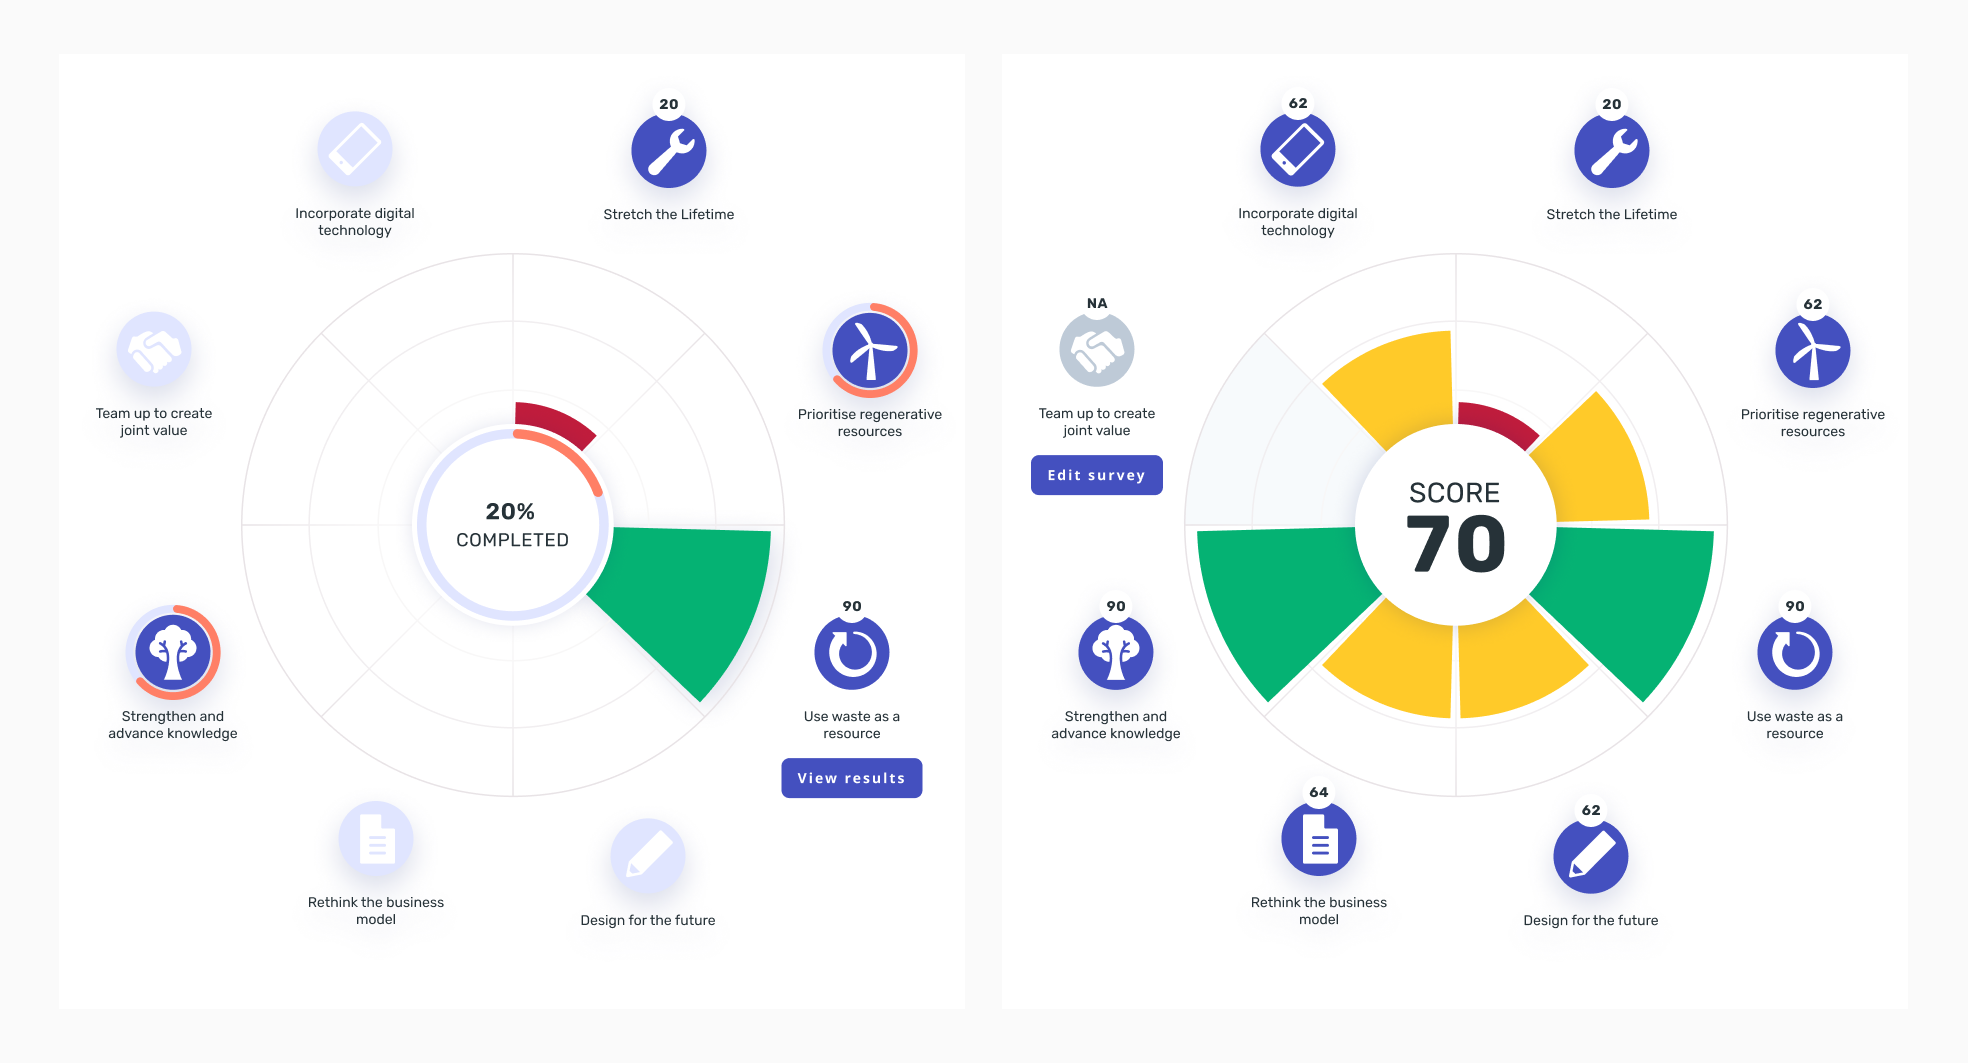
For for the survey data visualisation (see below) of a singular rebel we designed it to make it clear what category scores high/low. It can also be used for different type of rebels depending on the survey or framework used. When users clicks into a category it will show them case studies about circular initiatives/implementations of other similar organisations in that category. The case studies help to inspire the rebel on how to make their organisation more circular.